
November 13, 2025
Single-molecule kinetic measurements by magnetic force spectroscopy
Here we demonstrate how the technology underlying Depixus MAGNA One™ can be used to determine the kinetic and thermodynamic parameters of an interaction at the single-molecule level. We use Depixus’ magnetic force spectroscopy to study the hybridization of short DNA oligonucleotides to single-stranded DNA and determine the kinetic and thermodynamic parameters. Furthermore, we show that they are in close agreement with published values. These single-molecule measurements, performed at scale, allow molecular heterogeneity to be revealed, bringing insight into molecular behavior.
Magnetic force spectroscopy (MFS) is a single-molecule biophysics technique in which macromolecules are tethered between a flow cell surface and a paramagnetic bead. A controllable force is then applied to the molecules using a magnet, and their molecular extension in response to the force is measured through tracking of the position of each bead. This allows the behavior of individual molecules to be explored. Depixus MAGNA One provides this level of detail but scaled across thousands of molecules, all in an accessible laboratory instrument.
Depixus MAGNA One can be used to investigate the interactions between individual pairs of biomolecules by attaching them to DNA scaffold-bead complexes via oligonucleotide tags (Figure 1). When little or no magnetic force is applied, the pairs of molecules can interact and separate freely. When they are not interacting (Figure 1 B), there is very little constraint on the Brownian motion of the bead resulting in a high amplitude of vertical bead movement. In contrast, when the proteins bind together (Figure 1 C) there is a marked decrease in bead displacement. Tracking the individual bead heights over time therefore provides an unprecedented real-time view of how thousands of individual protein pairs associate and dissociate, allowing the interaction kinetics to be determined.
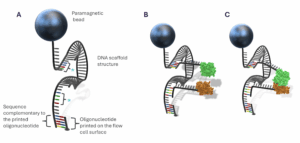
Figure 1. Schematic showing DNA scaffold-paramagnetic bead complexes used to study the interaction between two oligonucleotide-tagged biomolecules, here depicted as green and brown proteins. The two regions of single-stranded bases shown in color (*) are complementary to the oligonucleotide tags.
Determining kinetic parameters in force spectroscopy
While KD has become a standard metric (as well as the similar metric Ki) for quantifying interactions, relying on KD alone can give an incomplete or misleading picture as it does not show how fast the compounds bind or how long they remain bound. Two interactions may have the same KD but vastly different kon and koff values, leading to differing biological effects. Although techniques such as surface plasmon resonance and biolayer interferometry provide kon and koff, these types of ensemble approaches give only bulk averaged results and therefore struggle to reveal rare events and/or heterogeneity.
Force spectroscopy techniques, including MFS, allow the energy landscape of the interaction between two molecules to be redesigned. The injection of energy into the system permits the artificial creation of a quasi-equilibrium between the two states (bound and unbound) that allows the transitions to be observed more readily. However, the re-design of the energy landscape modifies both the encounter rates and energy barriers which means that the measured kon and koff values (referred to as k‘on and k’off) are different from the natural values.1 While these values are not absolute, they are still useful for comparing interactions between different molecule pairs. Furthermore, the natural k values can be derived using one of two approaches:
- Compensate for the contribution from the assay system (instrument, force and scaffold architecture) based on mathematical modelling
- Through specific experimental design. For example, by measuring k’off at a range of forces and extrapolating to zero force to calculate koff
However, in the case of very weak applied forces (typically below 50-60 fN) it can be assumed that k’off= koff, and koff can therefore be determined directly as the reciprocal of the average lifetime of the interacting (closed) state. To determine kon, it is necessary to record the transitions between the two states with the addition of one of the two molecules in free solution at a range of concentrations to create binding competition. Under these circumstances, the average lifetime of the open state increases linearly with the in-solution concentration.2 When the relationship is plotted, the ratio of the gradient over the y-axis intercept is equal to the ratio of kon over koff, allowing the former to be calculated. The thermodynamic parameter, Gibbs free energy (ΔG), can also be derived from the graph using the following formula:
ΔG = – RT ln (a/b) where R is the universal gas constant, T is the temperature in Kelvin, a is the gradient and b is the y-axis intercept.
Using DNA Hybridization as a model
For simplification, we used a DNA hybridization model to mimic the scenario shown in Figure 1B and C in which two proteins are freely interacting and dissociating. We replaced the two proteins with a short (32-base) oligonucleotide that attaches to one of the tag-binding sites (marked * in Figure 1A) at one end and is also able to attach to the second single-stranded site by its other extremity. A free-solution version of one of the complementary sequences could then be added at a range of concentrations to provide binding competition. This is illustrated schematically in Figure 2.
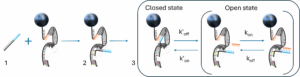
Figure 2. Schematic of the adaptation of the assay to measure the kinetics of hybridization of short oligonucleotides to the DNA scaffold, showing steps 1, 2 and 3.
Using a Depixus MFS instrument, this approach was used first to characterize the kinetic and thermodynamic parameters of the hybridization of an 8-base sequence (5′ CGAAGAGC 3′, shown in light blue in Figure 2) to its complementary sequence within the DNA scaffold structure. After recording of bead height data at 90 Hz for up to 90 minutes with an applied very low force of 50 fN, the same free-solution oligonucleotide sequence (shown in orange in step 3 of Figure 3) was then added at a range of concentrations with data recorded for each concentration.
Secondly, for comparison, the hybridization of the same 8-base sequence with addition of one additional non-complementary terminal base (5′ tCGAAGAGC 3′) was also characterized and compared using the same methodology.
In both cases the recorded data tracks were automatically cleaned and analyzed using Depixus’ MFS data analysis system. For each bead, the transitions between the closed and open states of the scaffold were detected to provide the distribution of lifetimes for the two states. The average lifetimes of the open state were plotted against free-oligonucleotide concentration and linearly fitted to recover the kon to koff ratio. The averaged lifetimes of the closed states were verified to remain constant over the oligonucleotide concentration range and the inverse of their averaged value provided koff.
Results and Comparative Analysis of Oligonucleotide Hybridization
Figure 3 and the table provide an example of the results obtained from one single-molecule for both the 8-base and 8+1-base sequences. The two graphs respectively show the lifetimes of the open and closed states of the scaffold as a function of the concentration of the short oligonucleotide in solution. The table additionally highlights comparative values reported in the literature for 8-base oligonucleotide hybridization 3,4 and shows that results obtained with Depixus’ MFS are consistent with published values.
The additional terminal non-complementary base had no effect on koff (Figure 3 left), while a clear change in the gradient of the plot of open state lifetime versus concentration (Figure 3 right) indicated an overall stabilization of the hybridized complex of around 0.4 kCal.mol-1. This finding is consistent with recent studies on the kinetics of oligonucleotide binding.5
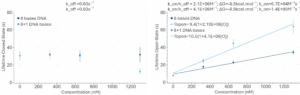
Figure 3. Comparison of the kinetics of hybridization between the 8-base (dark blue) and 8 + 1-base (light blue) oligonucleotides on a single DNA scaffold molecule. Left, the average lifetime of the closed state provided koff. Right: plotting the modulation of the lifetime of the open state against concentration of the competing in-solution oligonucleotide provided Gibbs free energy and allowed calculation of kon.
| Parameter | Depixus MFS 8-base sequence |
Results from similar published studies | Depixus MFS 8+1 base sequence |
|---|---|---|---|
| ΔG (kCal.mol–1) | -8.5 | -9.4 3 -8.3 4 |
-8.9 |
| koff (s–1) | 0.03 |
0.38 3 |
0.03 |
| kon (M–1s–1) | 0.7×10⁵ |
3.5×10⁶ 3 |
1.4 x10⁵ |
Notes on the published studies:
3 Obtained from a different 8-base DNA oligonucleotide, using single-molecule FRET; potential impact of fluorophore Cy3, different buffer.
4 Obtained from a different 8-base DNA oligonucleotide, using optical tweezers, with potential impact of both fluorophore Cy3 and poly-T construction; different buffer.
Conclusion
Here we have demonstrated that from single molecule measurements, Depixus’ MFS technology can provide a complete characterization of the kinetics of the interaction between two molecules and determine the thermodynamic parameter, Gibbs free energy. Using a DNA hybridization model system, we have shown that the kinetic and thermodynamic parameters obtained are consistent with values determined using other technologies.
We have also demonstrated that our technology can characterize changes in kinetics and Gibbs free energy caused by addition of a terminal non-complementary base to the hybridizing oligonucleotide. Furthermore, we were able to validate the resulting change in Gibbs free energy using published and modelled values.
It should be noted that this study has used oligonucleotide hybridization to model the behavior of two interacting proteins attached to the DNA scaffold. However, the methodology (including the same scaffold structure) is directly applicable to any pairs of biomolecules – from proteins, DNA aptamers, or RNA to small molecules (such as from DNA-encoded libraries).
References
- Liphardt J, Onoa B, Smith SB, Tinoco IJ, Bustamante C. Reversible unfolding of single RNA molecules by mechanical force. Science. 2001;292(5517):733-737. doi:10.1126/science.1058498.
- Rieu M, Valle-Orero J, Ducos B, Allemand JF, Croquette V. Single-molecule kinetic locking allows fluorescence-free quantification of protein/nucleic-acid binding. Commun Biol. 2021;4(1):1083. doi:10.1038/s42003-021-02606-z
- Dupuis NF, Holmstrom ED, Nesbitt DJ. Single-molecule kinetics reveal cation-promoted DNA duplex formation through ordering of single-stranded helices. Biophys J. 2013;105(3):756-766. doi:10.1016/j.bpj.2013.05.061
- Whitley KD, Comstock MJ, Chemla YR. Elasticity of the transition state for oligonucleotide hybridization. Nucleic Acids Res. 2017;45(2):547-555. doi:10.1093/nar/gkw1173
- Bommarito S, Peyret N, SantaLucia JJ. Thermodynamic parameters for DNA sequences with dangling ends. Nucleic Acids Res. 2000;28(9):1929-1934. doi:10.1093/nar/28.9.1929